
Historians for Future on the IPCC Report: Part 1, Where Are We Now?
This post is part of a H4F series on the Intergovernmental Panel on Climate Change (IPCC) Sixth Assessment Report, and what it means for the global climate, past and future.
At the beginning of August 2021, the Intergovernmental Panel on Climate Change (IPCC) Working Group I released its Sixth Assessment Report on the current state of the global climate and scientific understanding of it.[1] Running to nearly 4,000 pages and with hundreds of authors, this document is an impressive example of global scientific collaboration. It is part of a large body of work that stretches back to the IPCC’s First Assessment Report in 1990 — many active researchers in climate science and history today are younger than that first report. Yet, whilst among the most important scientific accounts ever produced, the IPCC reports can be difficult to understand. With this in mind, H4F wants to start some discussion around how the reports frame the climate crisis and our possible responses to it.
This is the first of a series of blog posts in which we will go through the Summary for Policymakers of the IPCC Working Group I Report. We will rephrase it in terms that are easier to understand, opening up these reports to anyone interested in climate action.
The Summary for Policymakers is divided into four parts: A, B, C and D. This post begins with Section A: “The Current State of the Climate.” Or, as we might also call it, Where are we now?
Section A is, itself, divided into four subsections. Each of these makes a key point, which we have rephrased here in the most direct way we can find, along with some of the subsidiary points:
A.1 – Human activities have caused the planet to warm up, undeniably so. This is true in the air, oceans, and on land. Changes have been both fast and widespread.
– The concentration of carbon dioxide in the atmosphere has increased by about 40% since 1750 as a result of human activity, almost entirely due to deforestation and the burning of fossil fuels.
– Since records began in 1850, human activity has warmed the planet by between 0.8°C and 1.3°C. Each of the last four decades has been successively warmer than all of the ones coming before them.
– Life on earth has already changed in ways we would expect from global warming: rainfall patterns have shifted, the amounts of snow and ice have diminished, the Arctic summer sea ice is retreating, sea levels have risen, and climate zones have moved towards the poles.
A.2 – The scale of these changes has been beyond anything we have seen for thousands of years, in some cases even millions.
– The atmosphere in 2019 contained more carbon dioxide than at any other time in the last 2 million years. Other greenhouse gases reached their highest levels in over 800,000 years.
– Since 1750, increases in carbon dioxide and other greenhouse gas emissions in the atmosphere have been far higher than can be normally expected from natural causes.
– The increase in global temperature since 1970 has been faster than in any other 50-year period in the last 2,000 years. Temperatures in the 2010s have been higher than the last time there was a sustained period of warming on a global scale, about 6,500 years ago.
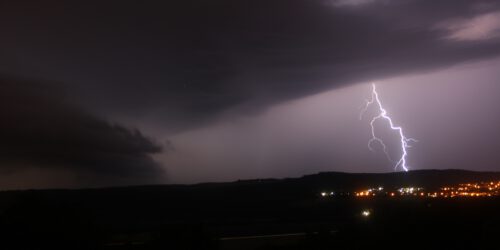
A.3 – Climate change, caused by humans, is already increasing extreme weather. This is true in every part of the globe.
– Since the 1950s, hot weather extremes have occurred more often and in more intense ways. On the other hand, cold weather extremes have not happened as frequently and have not been as severe. Heat waves in oceanic systems have become twice as common as they were in the 1980s. Human activity can be shown to be the cause of most of these heat waves since 2006.
– Heavy rainfall has increased across most of the planet since the 1950s, and it seems safe to say that human activity has caused this. Human-caused climate change has also increased the frequency of droughts in some places.
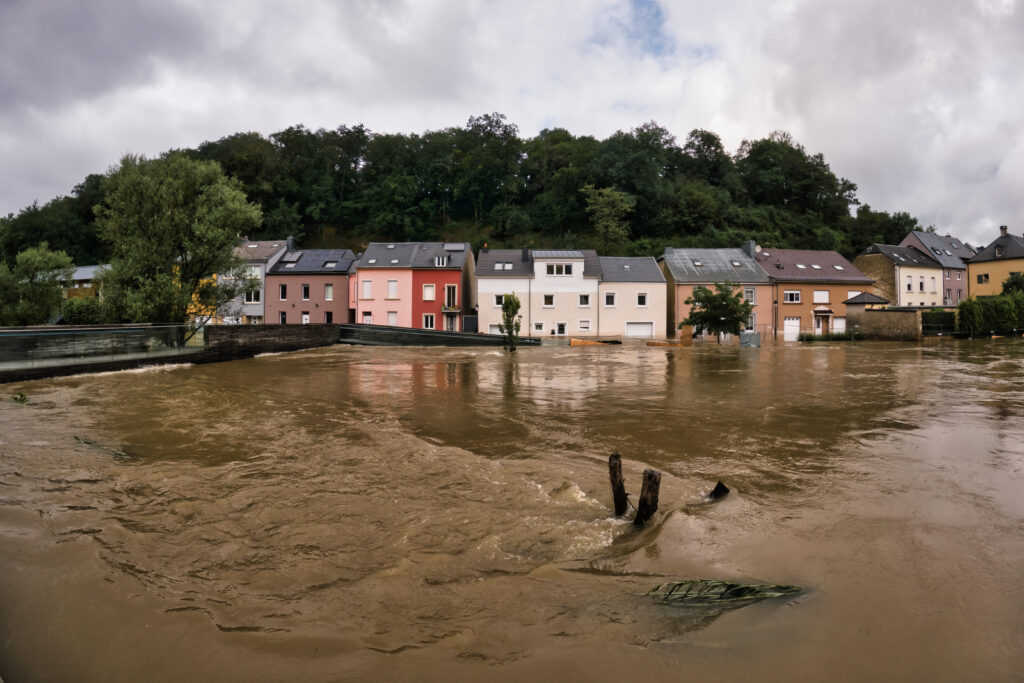
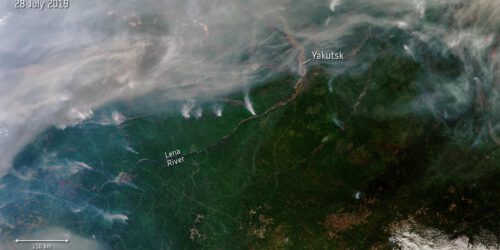
– Human activity has probably made so-called “compound extreme events” more likely to happen since the 1950s. This means there is an increased risk of: heat waves coinciding with drought conditions, hot weather making large fires more likely, and extreme flooding.
A.4 – If the amount of carbon dioxide in the atmosphere reaches double the levels it was before the Industrial Revolution, global temperatures will increase by between 2.5° and 4.0°C, probably close to 3.0°.
– This section is largely technical: it puts numbers on the amount of energy released into the atmosphere. The prediction about exactly what will happen to the climate if greenhouse gas concentrations increase is more precise than in previous reports. Bear in mind that right now carbon dioxide levels are 40% higher than they were in 1750.
– Most warming in the climate system happens in the oceans.
– Global warming causes sea levels to rise through the melting of ice and the warming of the oceans, which itself causes them to expand. Most of the recent rise in sea levels is down to melting ice.
Section A gives us a sense of what is happening to the climate system right now. This short overview gives a dramatic account of a climate already showing the effects of global warming. It shows that the climate system is changing dramatically; that this is caused by humans; that extreme weather is already being triggered by global warming; and that if greenhouse gas concentrations stabilise at high levels, the climate will be considerably warmer than at any period of human history. The fossil-fuel energy system used by an increasing proportion of humanity since the 1750s has created this situation.
Reading this account may make you ask what we can do, collectively or individually, to turn this around. For that, we must turn to Section B of the Summary for Policymakers, which we will decipher in our next post in this series.
[1] In 2022, two other Working Groups will also publish their contributions to complete the report in full.
Looking forward to the next one. Thank you