
Historians for Future on the IPCC Report: Part 2, Where Are We Going?
This post is part of a H4F series on the Intergovernmental Panel on Climate Change (IPCC) Sixth Assessment Report, and what it means for the global climate, past and future.
In our previous post, we learnt about the current state of the climate and its recent past. We read through Section A of the IPCC Working Group I’s Summary for Policymakers. Now we continue with Section B on “Possible Climate Futures.” How will our climate change between now and 2100: where are we going?
Section B is divided into five parts, all concerned with a range of scenarios or projections which show the likely climatic consequences of different levels of greenhouse gas (GHG) emissions. This section compares five possible futures for climate change in the near-term (2021-40), mid-term (2041-60), and long-term (2081-2100), relative to levels in 1850-1900.
The five possible futures range across various levels of possible future emissions from human activities, so-called Shared Socio-economic Pathways (SSP). This means that the numbers in their names do not indicate the likely temperature increases associated with each scenario, but rather show different analytical parameters. The first number identifies the SSP used, while the second number indicates the “radiative forcing” resulting from that scenario in 2100 (= the higher the number the greater the warming).
These scenarios are presented in some quite complex but very powerful visualisations, which we encourage you to explore on the IPCC website, using this post as an introductory guide.
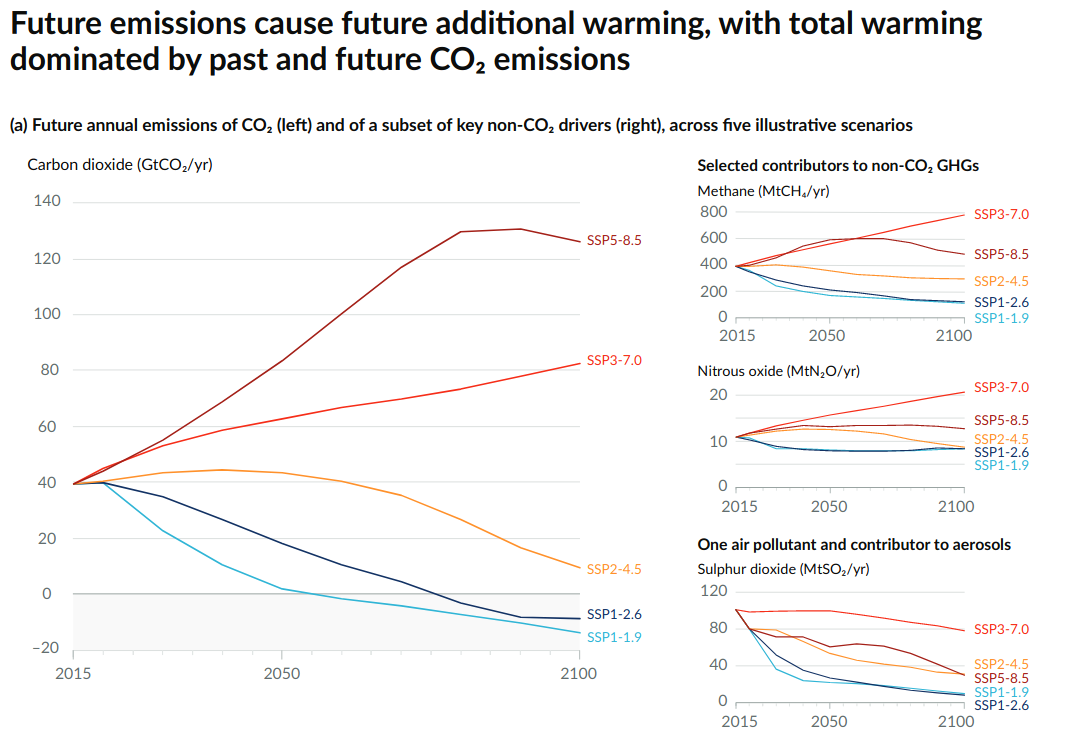
SSP1-1.9 imagines radical cuts to emissions starting in the 2020s and gathering pace through the 2030s. Global emissions reach zero around 2060 and continue to decrease steadily for the rest of the century, estimating a very likely increase of 1.0 to 1.8°C in global temperatures.
SSP1-2.6 is similar at first, with emissions decreasing slightly in the 2020s, but from the 2030s the decrease is far slower. Global emissions do not reach zero until around 2075, and do not fall as far below zero as in the first scenario, with a very likely temperature increase of 1.3 to 2.4°C.
Both of these futures require urgent global action immediately. They both require annual carbon emissions to begin falling in the next few years.
SSP2-4.5 imagines a future with much less radical action. Global emissions continue to rise year-on-year until around 2050, before finally beginning to fall. By 2100, emissions remain above zero, leading to a very likely increase of 2.1 to 3.5°C in global temperatures.
SSP3-7.0 imagines a steady, ongoing rise in emissions throughout the century, with global totals more than doubling by 2100. Annual CO2 emissions of more than 80Gt (= 80 billion tonnes) would lead to a rise in temperature of 2.8 to 4.6°C.
SSP5-8.5 imagines a future in which emissions continue to rise very rapidly in the next few decades, doubling by 2050. Some emergency mitigation measures slow this increase in the last decades of the century, but by this point annual global emissions have already tripled in comparison to 2015, resulting in a temperature increase of 3.3 to 5.7°C.
These five future scenarios allow for several assumptions and conclusions to be drawn:
B.1 – Global temperatures will continue to increase until 2050.
– Even with very low GHG emissions, an increase of 1.5°C will more likely than not be reached within the next two decades.
– Without deep reductions in GHG in the coming decades, temperature rises will exceed more than 2°C compared to 1850-1900 levels by the end of the 21st century.
B.2 – Changes in the climate system are reinforced by global warming.
– Even with a global warming increase of 1.5°C, the occurrence of extreme events such as heat waves, heavy precipitation, and agricultural droughts will intensify.
– Even in the very low GHG scenario, the Arctic will likely be practically sea-ice free in September at least once before 2050, due to the amplified warming in the Arctic which is two to three times the rate of global warming.
– Changes in temperature will occur with regional variations, meaning that mid-latitude (i.e. Western Europe, North America, Central and East Asia, southern Africa and parts of Australia) and semi-arid regions, and the South American Monsoon region will experience the highest increase in the temperatures of hottest days.
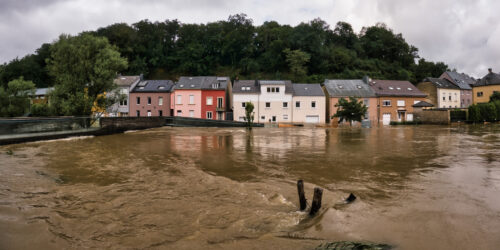
B.3 – Global warming will further intensify the global water cycle.
– The global water cycle is expected to become more variable within seasons and from year-to-year, including earlier onsets of spring snowmelt.
– Regional variations are expected to intensify, with the precipitation increasing in monsoon regions, and decreasing in subtropical areas.
B.4 – Ocean and land carbon sinks will not slow the accumulation of CO2 in the atmosphere with intermediate and very high CO2 emissions.
– Parts of the land and the ocean act as carbon sinks at this moment, meaning that they absorb carbon that would otherwise enter the atmosphere. But increasing temperatures will make these carbon sinks less effective. As a result, a higher proportion of emitted CO2 will remain in the atmosphere.
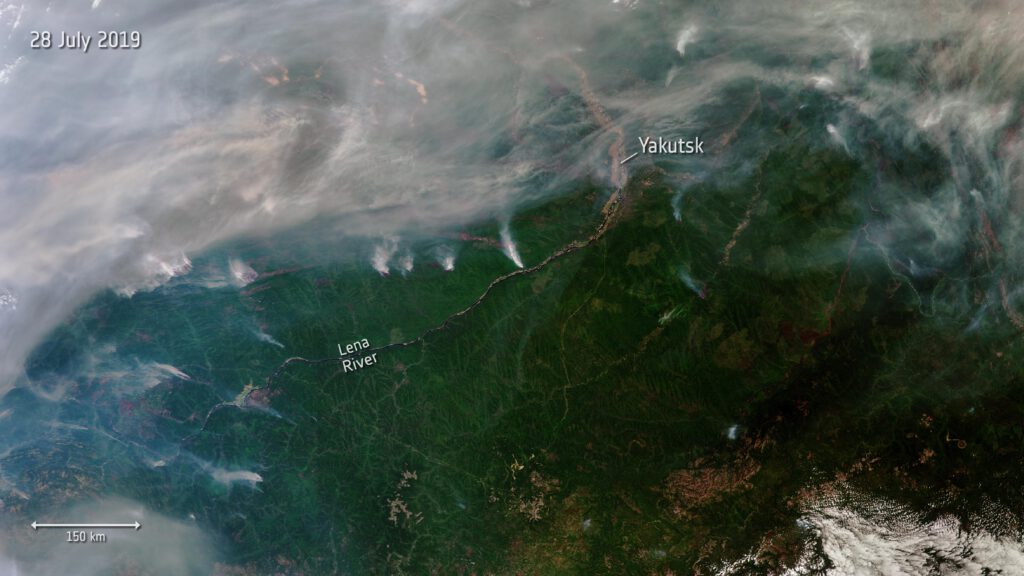
– Feedbacks between climate change and the carbon cycle become larger and more uncertain with higher emissions, which can be seen in the ways ecosystems respond to warming, such as increased carbon dioxide and methane fluxes from wetlands, permafrost thaw, and wildfires.
B.5 – Many changes are irreversible for centuries to millennia to come.
– Changes in global ocean temperature, deep ocean acidification, and deoxygenation will increase, mountain and polar glaciers will continue to melt and permafrost will thaw. These changes will be irreversible for hundreds to thousands of years to come.
– The virtually certain rise of average global sea levels will continue proportionally to the ice sheet melt and ocean warming. With an increase of 1.5°C, global sea level will rise by about 2 to 3 m over the next 2000 years; with an increase of 5°C, it will rise about 19 to 22 m.
Section B of the Summary for Policymakers is a stark wake-up call. It makes clear that global warming will have increasingly dangerous impacts over the rest of this century. Even the more optimistic scenarios predict irreversible changes to the climate. To limit warming to 1.5°C requires rapid decreases in global emissions beginning within the next few years and continuing towards negative emissions over the coming decades. If emissions increase, however, this would produce higher and increasingly dangerous levels of global warming.
Combined with Section A’s account of the climate as it is now, Section B leaves no doubt of the fact that the Earth is in a state of crisis. It gives a general idea of the scale of action needed, as well as the urgency with which these actions need to be taken.
The following Sections, C and D, will go into further detail on how to understand the risks of climate change in specific settings, and how to reduce the dangers ahead. We will cover these in the next two posts in this series, before offering some of our critiques of, and reflections on, the Summary as a whole.

2 Responses