
Historians for Future on the IPCC Report: Part 3, What Are The Risks?
This post is part of a H4F series on the Intergovernmental Panel on Climate Change (IPCC) Sixth Assessment Report, and what it means for the global climate, past and future.
So far, we have gone through Section A on the current problematic state of the climate and Section B on possible climate futures of the IPCC Working Group I’s Summary for Policymakers. This time, we have a look at Section C on “Climate Information for Risk Assessment and Regional Adaptation.”
Previous Working Group I reports (e.g. from the Fifth Assessment Report in 2013) did not deal with “risk assessment”. Future risks were outlined, but they were not put into a separate section. This is one of the big changes in the way the IPCC report treats climate change in the 2021 report: “Risk” is now a key concept. Rather than simply naming the potential risks in the future, it gives us a more concrete outline of dangers that informed policymakers must now respond to with adaptation planning.
In this report, risks include not just potential negative consequences of climate change such as floods, droughts or heat waves, but also the dangers that come from how humans respond to climate changes: where and how we build safe buildings, how we secure water supply, or how we try to manipulate local weather by intervening with technological inventions (e.g. through geoengineering). This new perspective on risks also includes more focus on regional and even local dimensions. The report is quite clear that climate change affects every country, town, village, coast, forest, valley, or river in some way: knowledge is key.
The IPCC report has to navigate very difficult waters: on the one hand, it has to correspond with different scientific findings and present the objectively established facts that climate change is man-made and accelerating. On the other hand, it must avoid allegations that the reporting is too alarmistic. Section C can therefore be read as the part of the report that gives policymakers a solid basis for decision-making and a “nudge” to prepare proper risk assessments on local, regional, national and global levels.
Section C is divided into three parts. Each part is dedicated to showing how climate change not only affects global warming, but also has and will have profound effects on regional and local climates. Regional changes can and will differ from general global warming, and they will be noticeably different at 2°C compared to 1.5°C global warming. And finally, regional low-likelihood events become more likely and have to be part of decision-makers’ risk assessments.
The three parts are centred around three key aspects of climate information:
1. Variability versus global climate change;
2. Climatic impact drivers;
3. Low-likelihood and high impact outcomes.
What do these terms mean?
C.1 – Variability versus global climate change.
There have always been “natural” events that have caused global warming, such as volcanic eruptions or solar storms. These so-called “natural drivers” of climate change have long masked the long-term changes caused by humans. That means that it is difficult to assess what change in global temperature is caused by “natural” variability and what by human-made interventions. In addition, there are the effects of the two “forces” interacting with each other: They can amplify climate change, but they can also mitigate it – especially in the short term and at the regional level.
A good example is El Niño – that is the name of the warm phase of the irregular periodic variation in winds and sea surface temperature over the tropical eastern Pacific Ocean, which affects the climate of much of the tropics and subtropics. El Niño is a so-called “internal variability,” and the report suggests that it might have amplifying but also mitigating effects on the human caused changes. However, it is unclear what impact these mutual effect amplifications and mitigations will have – especially on a regional level. Yet, the report shows that the near-term changes, for example in monsoons and their heavy rains, will be dominated by the effects of internal variability. The important thing to keep in mind is this: It is likely that at least one large volcanic eruption will occur during the 21st century. The massive explosion would reduce temperatures, alter monsoon circulation and change many climate impact drivers for a few years. But also: it would temporarily and partially mask human-caused climate change.
C.2 – Climatic impact-drivers.
Before we start: what exactly are climatic impact-drivers (CIDs)? The report defines CIDs as “physical climate system conditions (e.g., means, events, extremes) that can be directly connected with having impacts on human or ecological systems.” The term covers all kinds of impact, whether detrimental or positive. For example, a flood may damage a human city while having a beneficial impact on an ecosystem; in either case it is certainly a CID. You can find the most relevant CIDs in the figure below.
If we head for a 2°C increase in global warming instead of a 1.5°C, these CIDs will change more dramatically – everywhere. All regions will experience further increases in hot CIDs and decreases in cold CIDs. But CIDs will not be single events, they tend to affect each other.
There is only one illustration in Section C. It is an overview over the multiple climatic impact drivers projected to change everywhere:
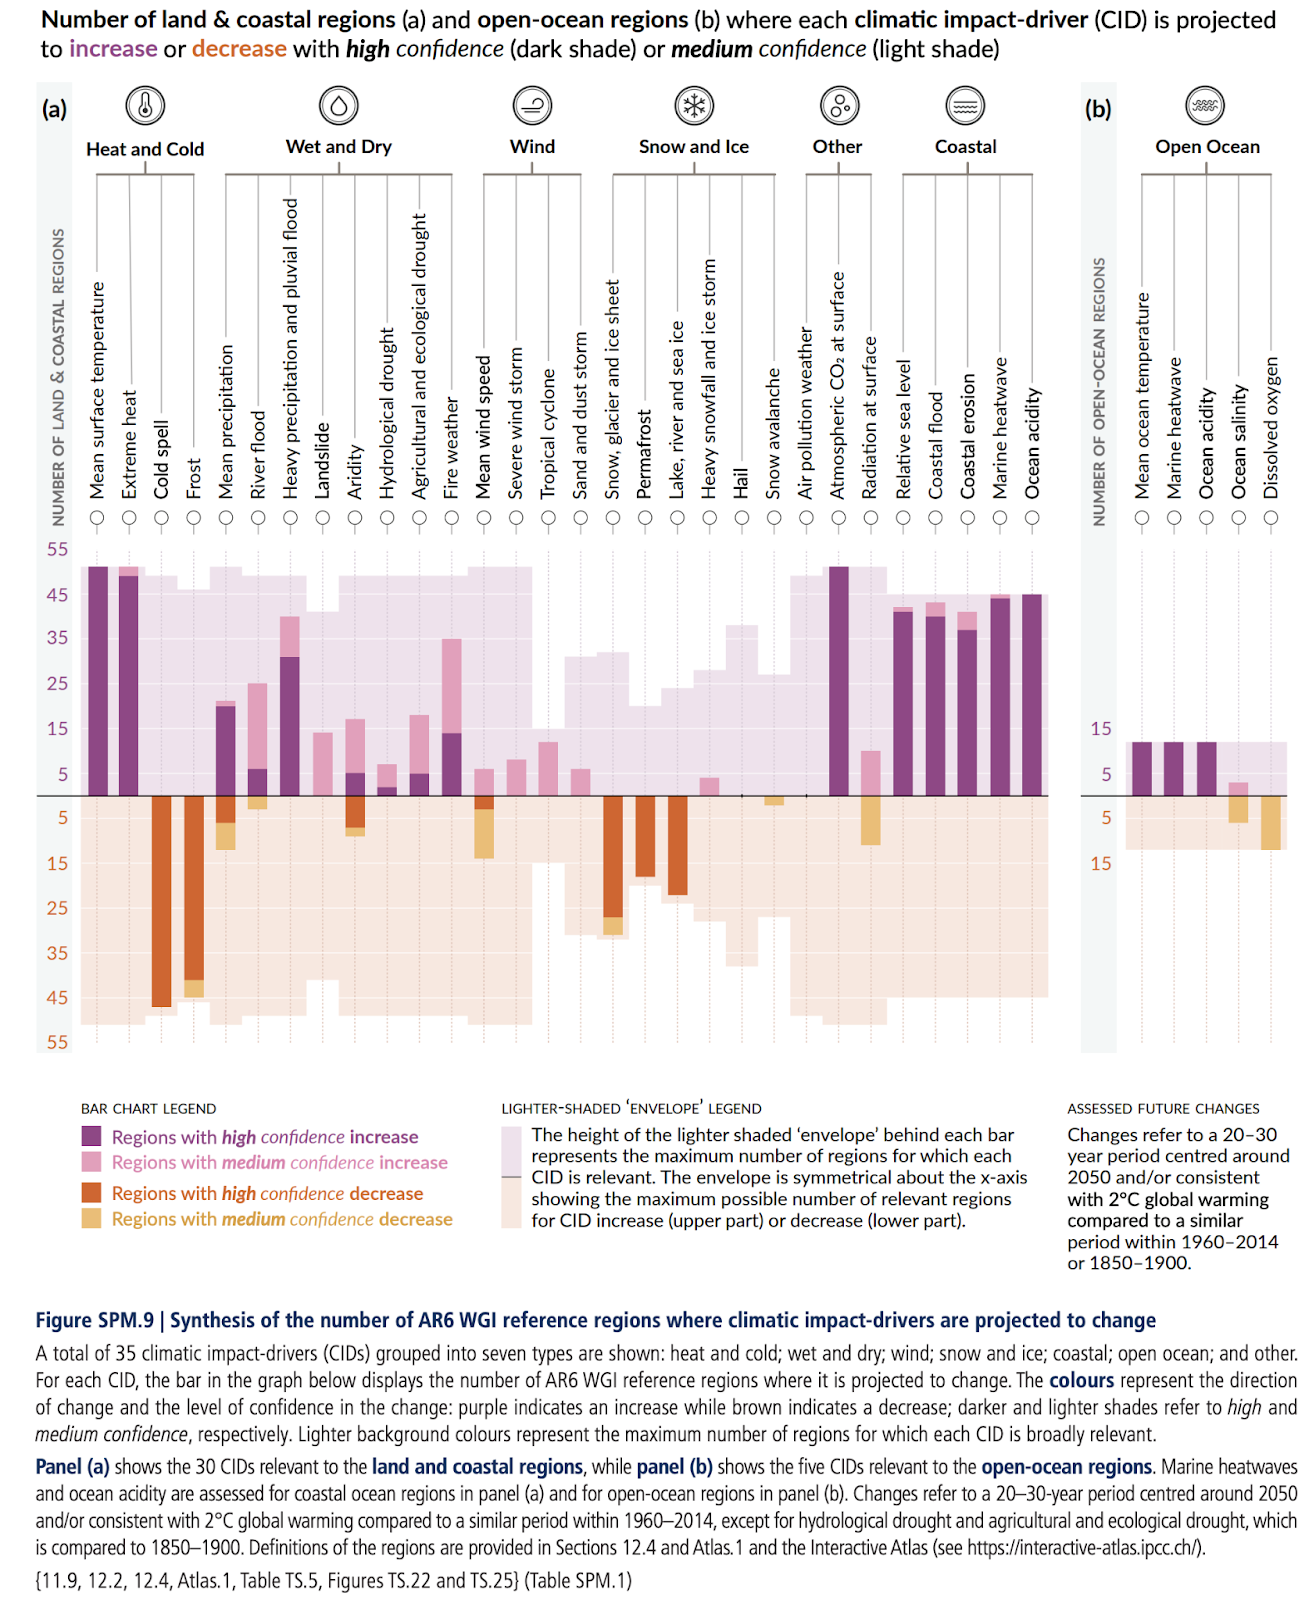
Let’s have a look at two striking projections:
– First, heat and cold: The first four bars summarise the effects of global warming on temperature scenarios. An increase in mean surface temperature and extreme heat waves is very likely in many land and coastal regions. At the same time, cold spells and frost will decrease with almost the same likelihood.
– The second group of CIDs that immediately catches our eye is the dramatic increase of CIDs in coastal regions. Coastal regions will not just be affected by the CIDs just mentioned, but also by sea level changes, coastal flooding and erosion, and ocean acidification. The report concludes that in any case, regional mean sea level rise will continue throughout the 21st century almost everywhere, a fact that is not just very likely, but “virtually certain”. The consequences for coastal cities will be very hard: they will have to face a combination of sea level rise, storm surges, extreme rainfall and/or riverflow events on the one hand, and more frequent hot extremes on the other.
All changes in CIDs will be more dramatic with 2°C of global warming than with 1.5°C.
C.3 – Low-likelihood and high impact outcomes.
The last section deals with what are called “low-likelihood, high impact outcomes”. These are events which are unlikely or hard to predict but that could dramatically impact societies and ecosystems. Unlike CIDs, which can be predicted fairly accurately, these extreme events and combined effects that cannot be predicted but are becoming more likely. Here the report is clear that even if low greenhouse gas emissions scenarios are only slightly exceeded, the global and regional changes would also exceed their very likely ranges.
In other words, low-likelihood, high impact outcomes will become more and more likely, more frequent, more intense and more permanent. This means that so-called tipping points such as the Gulf Stream, which is an important factor for the mild Western European climate, will most likely be affected. The Gulf Stream is itself part of a larger system called the Atlantic Meridional Overturning Circulation, or AMOC. There’s a good chance AMOC will weaken over the 21st century – in all emission scenarios! [for more on the scenarios, see our previous post]
It is still unclear to what extent such a continuous collapse will affect other CIDs, but it is again very likely that it would cause abrupt shifts in regional weather patterns and water cycles. Finally, there are of course unpredictable and rare natural events, such as massive explosive volcanic eruptions. These low-likelihood, high impact events can always occur, but they could intensify the effects of CIDs even more.
Yes, these findings may sound familiar, but it is the structured synopsis of section C that does the trick: the IPCC report helps us understand the compound quality, the interactions, and the complexity of the various CIDs, which could and should create a solid basis for an appropriate risk assessment.

1 Response